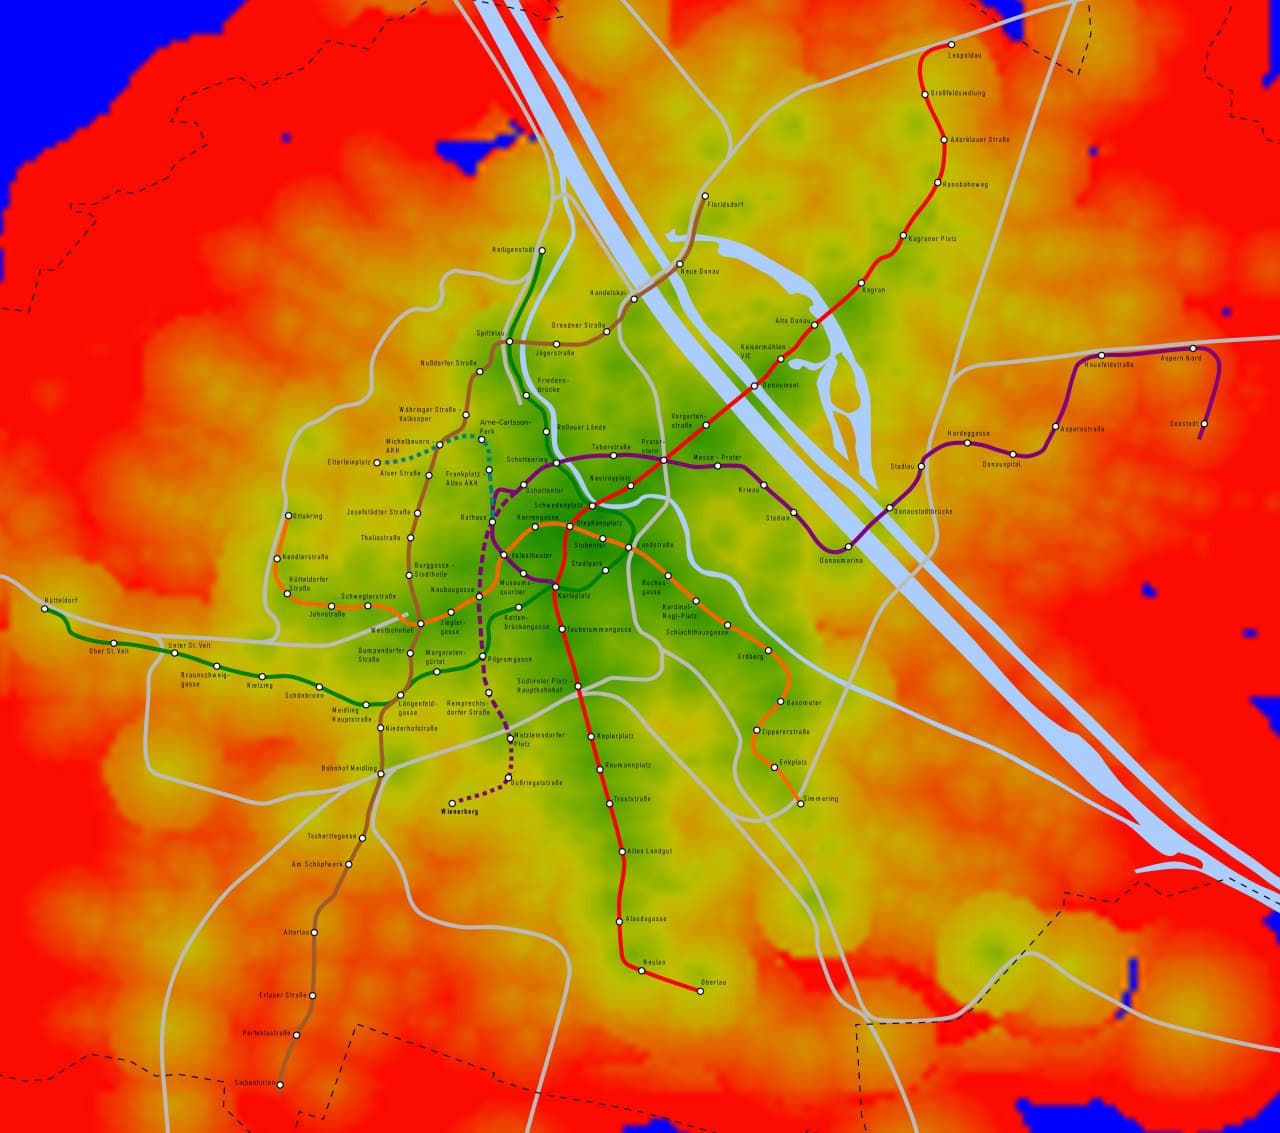
Visualization of minimal time needed to get by public transport and walking from any point in Vienna to its city center.
This site contains a selected number of projects I did (and most probably never completely finished) and am currently working on. It is not complete and gets updated (hopefully) regularly.
Imagine a city. Given a location in it, a natural question is how centrally located it is? Clearly, one may take the Euclidean distance from the location to the city center, however this hardly answers the question: in the real world the fastest path is not the "beeline" of the two points. We are restricted by houses, roads, traffic, etc. This leads to the investigation of the "central" locations if the protagonist is walking or driving. In my eyes, even more interesting, is the question for such locations if public transport is allowed. I live in Vienna, therefore my task is:
Visualize the minimal time needed to get by public transport and walking from any point in Vienna to its city center Stephansplatz.
A detailed map of all public transport of Vienna is available here at the official Website of Wiener Linien, the company running most of the public transit network in the city.
In order to deduce the time required to get from A to B by public transport it is necessary to use a good API. Even though
Wiener Linien and Google provide such services, it turned out that the simplest way is to use
Microsoft Bing Maps. Indeed, the following function
was easily implemented and consists of just a few lines of Python code: origin2time(origins, destination).
It gets as input a list of origins and a destination (as coordinates) and outputs a list of minutes needed to get from each origin to the destination. For example,
origin1 = (48.219474,16.367809)      		#Faculty of Mathematics
origin2 = (48.214839, 16.406007)     		#University of Economics and Business
destination = (48.208821, 16.372493) 		#Stephansplatz
origin2time([origin1, origin2],destination)
[11,18], meaning that it takes 11 minutes to get from Faculty of Mathematics to Stephansplatz and 18 minutes from the
University of Economics and Business to the same destination by public transport.
We laid a 420x350 grid over the map of Vienna, which turns out to be a rectangle with proportions approximately 6:5. This means
that a square of this grid corresponds to roughly a 50x50 meters square in real life. We ran the function origin2time(origins, destination)
in batches of 50 and created a dictionary with keys (i,j) standing for the indices in the grid and self-explanatory values
(x_coordinate,y_coordinate, time). Here are the first elements in the dictionary:
(0, 0): (48.11949721989749, 16.249281367211044, 72),
(0, 1): (48.11999746291627, 16.249281367211044, 72),
(0, 2): (48.12049770593504, 16.249281367211044, 61),
(0, 3): (48.120997948953814, 16.249281367211044, 61),
(0, 4): (48.121498191972584, 16.249281367211044, 60),
(0, 5): (48.12199843499136, 16.249281367211044, 59),
(0, 6): (48.12249867801014, 16.249281367211044, 59),
(0, 7): (48.12299892102891, 16.249281367211044, 58),
Finally, it remains to visualize the findings. Here are two pictures:
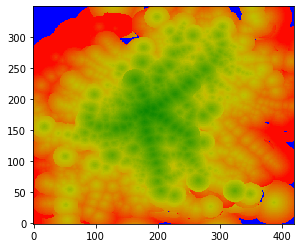
The picture on the right is an overlay of the left one and a simple map of public transport in Vienna. Note that metro stations are, as expected, centers of green blobs. But not only they: we clearly see where train stations are on the south-west and also recognize tram stations on the west. Feel free to investigate the images further!
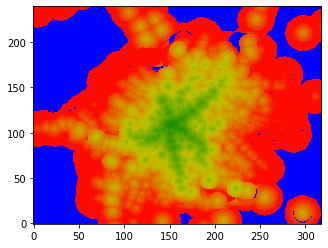 Here is a zoomed out picture, in which one clearly sees more train
stations and also the airport. As mentioned, the color blue stands for points from which no reasonable public transport path to the city center was
found.
Here is a zoomed out picture, in which one clearly sees more train
stations and also the airport. As mentioned, the color blue stands for points from which no reasonable public transport path to the city center was
found.
There are still many things to do in this project. For example, the color scale which is chosen now is suboptimal, since transition from green to red
looks very fast. Another task would be do the same picture with a bunch of other destinations and compare them. Finally, we should explore other cities.
 If you are interested in how R can be used for rendering, you can download this file to get started.
Visualization of minimal time needed to get by public transport and walking from any point in Vienna to its city center.
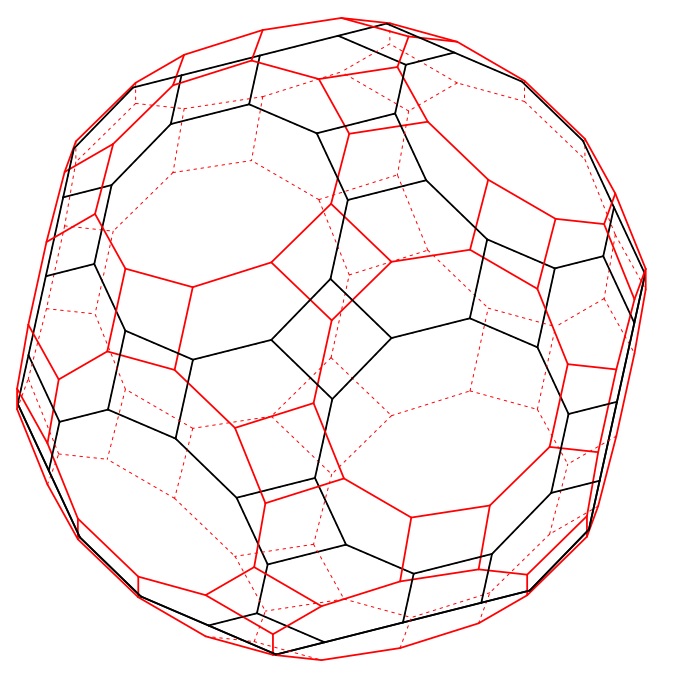
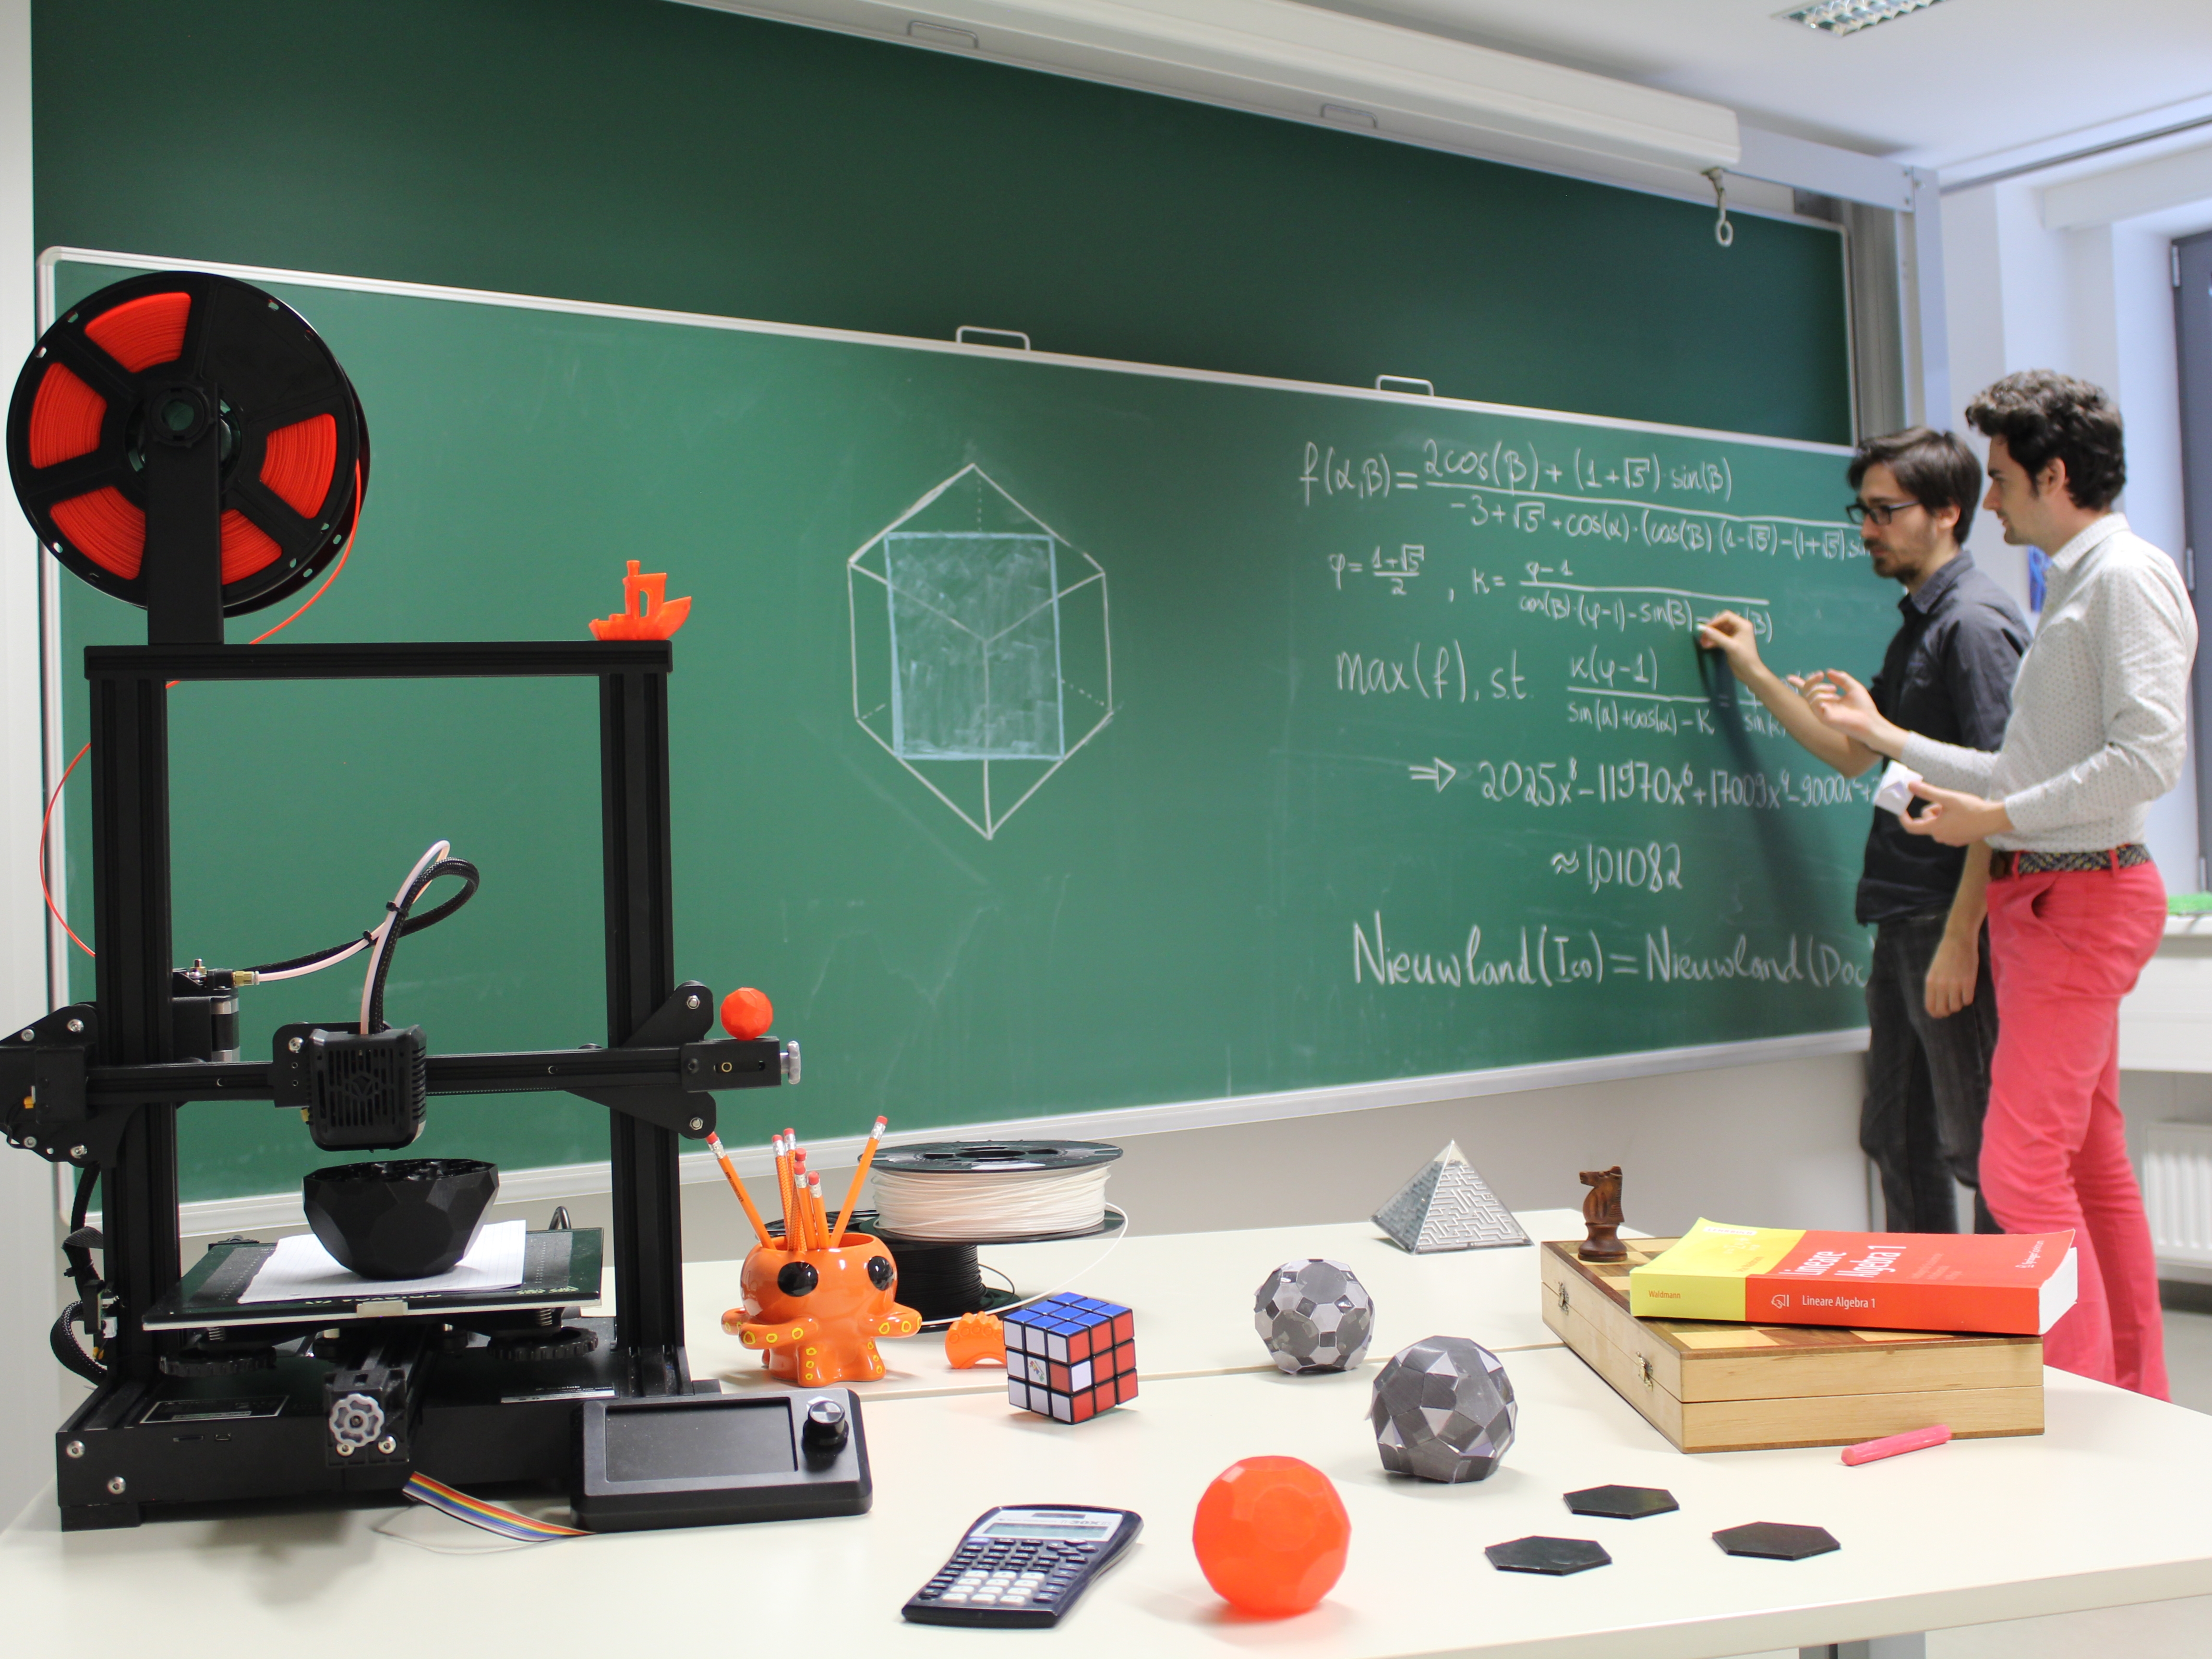
Proof that the The Truncated Icosidodecahedron is Rupert.
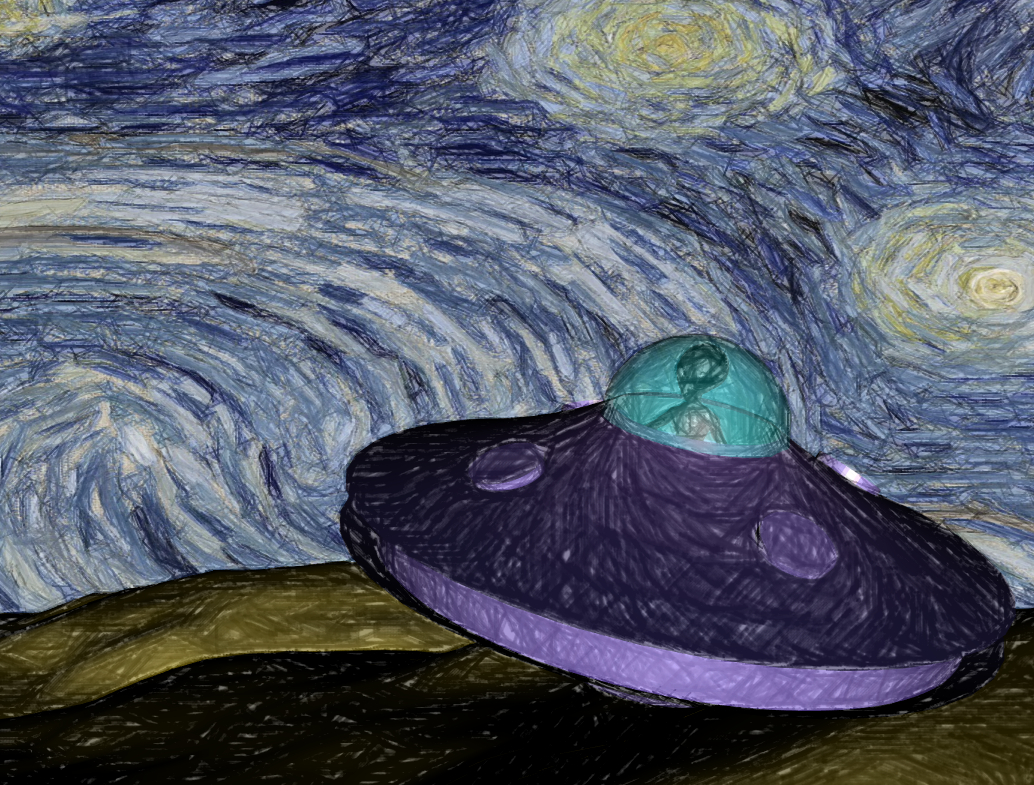
Endless Engines - Vincent's Volitation